

Green Button Go Orchestrator
Connect. Coordinate. Command.
Connect. Coordinate. Command.
Bring harmony to your lab’s automation with Green Button Go Orchestrator—the software platform that unites workcells, data systems, and analysis tools into one intelligent network. Built on the power of GBG Scheduler, GBG Orchestrator gives scientists, engineers, and IT teams the tools to scale and streamline lab operations without disruption.
Automation without boundaries
From scheduling instruments to synchronizing entire departments, GBG Orchestrator lets you move beyond individual workcells and build truly connected lab ecosystems. Orchestrate multi-step, multi-site workflows from a single platform.
Full video for Automation without boundaries
Why labs rely on GBG Orchestrator
End-to-end automation, realized
Coordinate complex, multi-workcell workflows with centralized logic and data sharing
Command every corner of your lab
Integrate LIMS, ELN, and analysis tools directly into automated workflows
Work smarter across teams
Built for scientists, programmers, and IT to collaborate through data and automation
Modular by design
Add, upgrade, or troubleshoot individual workcells without disrupting your system
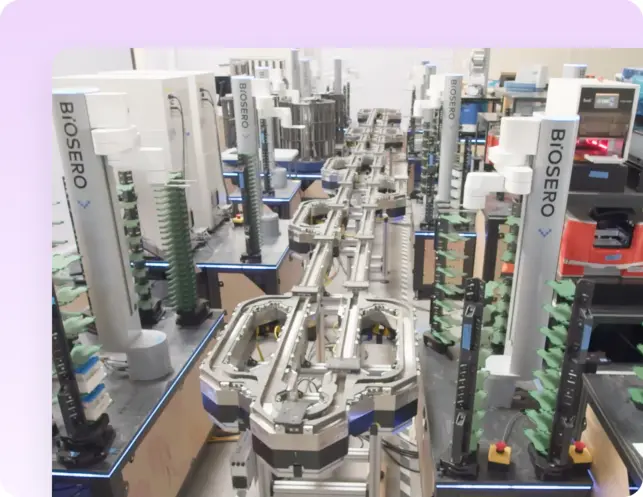
The connected lab starts here
Green Button Go Orchestrator enables modular workcells to communicate with one another—and with everything else in the lab. Move beyond siloed automation and unify your systems into one coordinated, data-rich network.
Create workflows across your entire lab
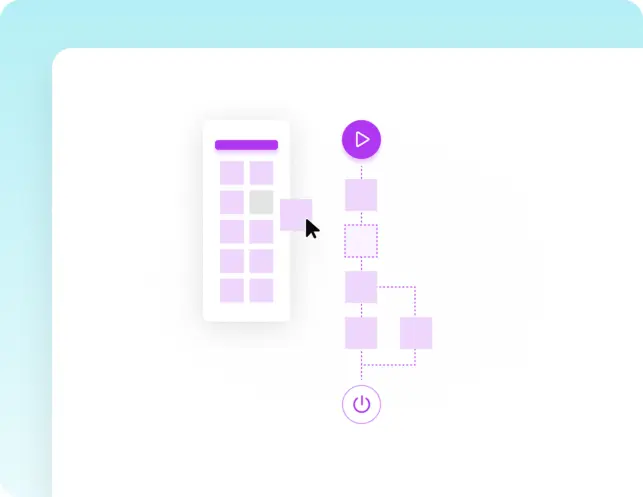
Create workflows across your entire lab
From bench instruments to data platforms, GBG Orchestrator lets you design workflows that span the full scientific process—with drag-and-drop ease.
Run dynamic workflows around-the-clock
Run dynamic workflows around-the-clock
Launch and monitor labwide workflows at any time. Built-in scheduling tools and real-time responsiveness ensure you’re always ready to run.
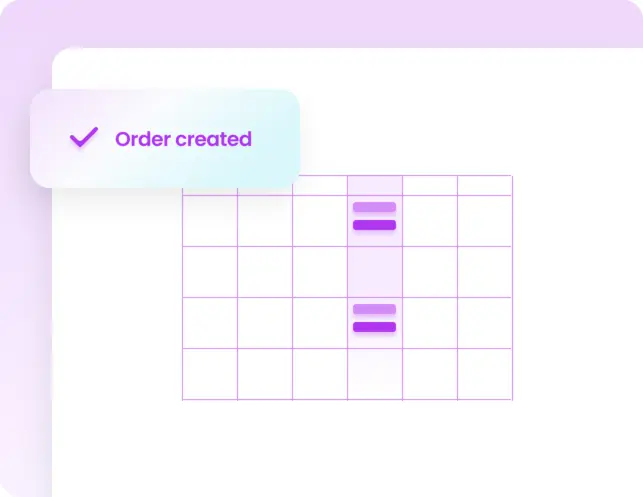
See everything. Track everything.

See everything. Track everything.
GBG Orchestrator includes dashboards for real-time monitoring, plus detailed logs of workflow performance, data flow, and instrument activity.
Your lab’s data, flowing freely
GBG Orchestrator includes Data Services, a hub that moves scientific, system, and environmental data across instruments, workcells, and enterprise systems—locally or in the cloud.
How it works
Titian Mosaic - Prepare job by user request
GBG Orchestrator - Store job information as identities
GBG Scheduler - Process jobs across workcells
GBG Orchestrator - Update job status
Titian Mosaic - Send job status back to Mosaic
Transportation Manager
Go beyond the workcell with intelligent transport
Go beyond the workcell with intelligent transport
Use Transportation Manager to automate labware movement between workcells and standalone instruments. Integrate tracks, conveyors, planar systems, and more—all orchestrated seamlessly.

Built for your whole lab team
Operator scientists
Launch workflows across the lab—automated or manual
Principle scientists
Design experiments that span instruments, locations, and systems
Automation engineers
Configure integrated workcells with extensible hardware and software
Programmers
Inject advanced logic and controls into every workflow
IT Specialists
Connect lab automation to enterprise infrastructure and data lakes
Data Analysts
Access and analyze data from every source in the lab ecosystem
Powerful architecture, flexible deployment
Install locally for simulation and prototyping. Deploy in the cloud for scale and control. GBG Orchestrator runs where your lab runs.
Workflow Designer
Desktop app to design workflows with a graphical UI
Workflow Conductor
Web app to launch and manage lab-wide workflows
Data Services
Central hub for communication and data orchestration
Transportation Manager
Orchestrates physical movement between systems
Green Button Go Orchestrator is the next step—unlocking full-lab integration and automation. Build flexible, scalable systems that grow with your science.